Alleviation: An International Journal of Nutrition, Gender & Social Development, ISSN 2348-9340
Volume 2, Number 2 (2015) : 1-7
©Arya PG College, Panipat & Business Press India Publication, Delhi
www.aryapgcollege.com, www.apcjournals.com
Expenditure Pattern of Urban Families
1. Dr. Anju Chaudhary & 2. Dr. Binoo Sehgal
1 Associate Professor, Department of Home Science, Government College for Girls, Hisar (Haryana), India
2 Professor, Department of Family Resource Management, Faculty of Home Science, CCSHAU, Hisar (Haryana), India
E-mail: anjuchaudhary75@gmail.com
Introduction
The pattern of expenditure is dependent on many factors i.e. on the income of the families or persons, growth or decrease in income, family size and age of family members, cross price elasticity of demand for certain commodities, common behavior, habits, employment, commodity structure and change in it, personal and social preferences, taste and new fashions etc.
The Engel’s law concerning food consumption seems to be valid not only in the developed countries but also in the developing ones, though with different efficiency.
In the urban Indian society, most of the families are money income earning families who use the money earned to buy goods and services in the market place to fulfill the family needs. In these types of families, it becomes essential to allocate, utilize and evaluate the use of money and money is a limited resource, therefore, it should be used wisely because along with the present needs, the family savings are also required to fulfill the future needs. There are several reasons for saving the money. Some of them are foreseeable while others are not. Provisions for old age, children’s education as they grow up, marriages and building of place to live in after retirement are some of the common reasons for family to put away money by ways of saving. On the other hand, there are often contingencies which are not foreseeable. An accident to the bread winner of the family, for instance can mean that expensive treatment becomes necessary or it becomes essential to undertake travel to another place for treatment. Over and above such reasons, if one can afford to save, the saving can itself be made to earn more money. It must however be remembered that an attempt to save should not be at the cost of current necessities like nutritious food, good clothing, clean housing and purposeful education. In the light of the above facts, the following study was conducted in the urban area of Haryana state.
Materials and Methods
For the survey, two cities (Hisar and Rohtak) of Haryana state were selected. Five organizations from each city were selected and from each of these organizations, thirty employed respondents having annual income more than Rs. 60,000 per year (Income tax paying families were selected randomly, thus making a total sample of 300 respondents. The data were collected with the help of well structured interview schedule which was duly pretested. Frequencies and percentages were calculated to describe the profile of the respondents along with income, expenditure and financial management practices etc. of the respondents. Correlation coefficient test was used to determine the correlation of independent and dependent variable i.e. expenditure pattern of the families.
Results and Discussion
Average Monthly Per Family and Per Capita Expenditure on Different Food and Non Food Items (Family Income Between Rs. 7000-16000 Per Month)
Expenditure pattern of urban families having monthly income between Rs. 7000-Rs.16000 per month has been presented in Table 1. Per family and per capita monthly expenditure pattern on food and non-food items was analyzed. The findings reveal that majority of the families (78.7 %) used to spend between Rs. 1500-Rs. 3300 p.m. on food items and their per capita expenditure on food was between Rs. 341-Rs. 750. Rest of the families (21.2%) used to spend between Rs.3301-Rs. 5100 per month on food and their per capita expenditure per month on food ranged between Rs. 647-Rs. 1000.
Regarding expenditure on clothing, it was found that 72.3 per cent of families used to spend between Rs. 200-Rs. 850 per month and their per capita expenditure ranged between Rs. 46-Rs. 197 whereas 27.6 per cent of families used to spend between Rs. 851-Rs. 1500 on clothing and their per capita expenditure was between Rs.170-Rs. 300.
Regarding expenditure on shelter, it was observed that majority (80.3%) of the families used to spend between Rs. 100-1600 per month on shelter and their per capita expenditure was between Rs. 21-Rs. 347. Only 17.5 per cent of the families used to spend between Rs. 1601-Rs. 3100 per month on shelter and their per capita expenditure was between Rs.363-Rs. 704. Negligible number of families (2.1%) used to spend between Rs. 3101-Rs. 4600 per month on shelter and their per capita expenditure was between Rs. 838-Rs. 1243.
Expenditure on health shows that majority of the families (96.8%) from this income group (Between Rs. 7000-Rs. 16000 per month) used to spend between Rs. 50-Rs. 500 per month on medicine and these families had per capita expenditure between Rs.11-Rs. 111. Rest of the families (3.1%) used to spend between Rs. 501-Rs. 1000 per month on medicines and their per capita monthly expenditure was between Rs. 112-Rs. 222.
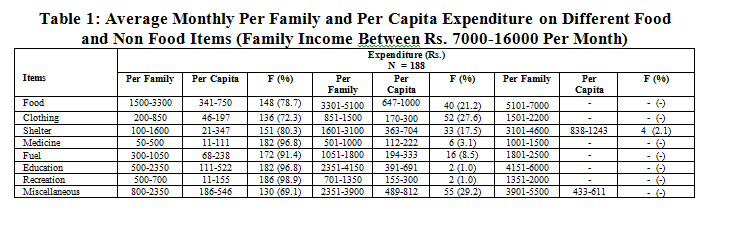
Majority of families (91.4%) used to spent between Rs. 300-Rs. 1050 per month on fuel (Per capita expenditure was between Rs. 68-Rs. 238 per month) whereas rest of the families (8.5%) used to spent between Rs. 1051-Rs. 1800 per month with per capita expenditure between Rs. 194-Rs. 333.
Expenditure on education shows that maximum number of families (96.8%) used to spend between Rs. 500- Rs. 2350 per month on education with per capita expenditure between Rs. 111-Rs. 522 per month. Very few number of families (1.0%) had monthly expenditure between Rs. 2351-Rs. 4150 and their per capita expenditure on education was found to be between Rs. 391- Rs. 691 per month.
Expenditure on recreation shows that majority of the families (98.9%) used to spend between Rs. 50-Rs. 700 per month on recreation activities (Per capita expenditure between Rs. 11- Rs. 185). Only 1.0 per cent of families used to spend between Rs. 701- Rs. 1350 per month on recreation activities (Per capita expenditure was between Rs. 155- Rs. 300).
Regarding expenditure on miscellaneous items, it was observed that majority of the families (69.1%) used to spend between Rs. 800-Rs. 2350 per month on miscellaneous items (Per capita expenditure was between Rs. 186- Rs. 546). Nearly one- third of the families (29.2%) used to spend between Rs. 2351- Rs. 3900 per month on miscellaneous items and their per capita expenditure was found to be between Rs. 489- Rs. 812. Only 1.5 per cent of families used to spend between Rs. 3901- Rs. 5500 per month on miscellaneous items (Per capita expenditure was between Rs. 433-Rs. 611). Thus, it can be briefed that the maximum expenditure per family (Having monthly income between Rs. 7000-Rs. 16000)
was on food items, followed by miscellaneous items and education while minimum expenditure was on medicines.
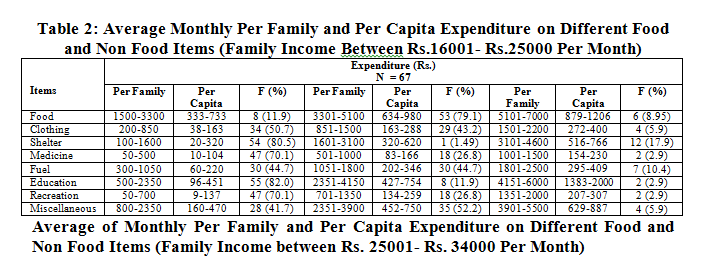
Average Monthly Per Family and Per Capita Expenditure on Different Food and Non Food Items (Family Income between Rs.16001- Rs. 25000 Per Month)
The data in Table 2 indicate that among the respondents belonging to the income group between Rs. 16001-Rs. 25000, majority of the families (79.1%) used to spend between Rs. 3301-Rs. 5100 on food per month (Per capita expenditure between Rs. 634- Rs. 980). Majority of the families (50.7%) used to spend between Rs. 200- 850 on clothing (Per capita expenditure between Rs. 38-Rs. 163), 80.5 percent of the families used to spend between Rs. 100-Rs. 1600 on shelter (Per capita expenditure between Rs. 20-Rs. 320) and 70.1 percent of the families used to spend between Rs. 300-Rs. 1050 (Per capita expenditure between Rs. 60-Rs. 210) and Rs. 1051- Rs. 1800 on fuel per month (Per capita expenditure between Rs 202- Rs. 346). When education was taken into consideration, it was observed that majority of the respondents (82.0%) used to spend between Rs. 500- Rs. 2350 on education per month (Per capita expenditure between Rs. 96-Rs. 451). Regarding expenditure on recreation, it was noted that majority of the respondents (70.1%) used to spend between Rs. 50-Rs. 700 on recreation per month (Per capita expenditure between Rs. 9-Rs. 137). Expenditure on miscellaneous items shows that majority of the families (52.2%) used to spend between Rs. 2351-Rs. 3900 per month on miscellaneous items (Per capita expenditure between Rs. 452-Rs. 750). It was observed that among the various miscellaneous items, the major expenditure was on electricity bills.
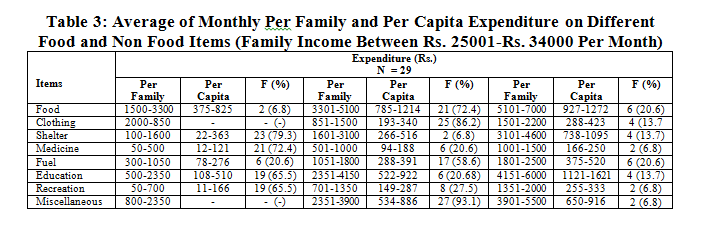
Analysis of Table 3 reveals that in the income group between Rs. 25001-Rs. 34000, majority of the families used to spend between Rs. 3301- Rs. 5100 (72.4%) on food per month, with per capita expenditure between Rs. 785-Rs. 1214; between Rs. 851-Rs. 1500 (86.2%) on clothing (Per capita expenditure between Rs.193-Rs. 340), between Rs.100-Rs. 1600 (79.3%) on shelter (Per capita expenditure between Rs. 22-Rs. 363), between Rs. 50-Rs. 500 (72.4%) on medicine (Per capita expenditure between Rs. 12-Rs. 121), between Rs. 1051-Rs. 1800 (58.6%) on fuel (Per capita expenditure between Rs. 288-Rs. 391), between Rs.500-Rs. 2350 (65.5%) on education (Per capita expenditure of between Rs. 108-Rs. 516), between Rs. 50-Rs. 700 (65.5%) on recreation (Per capita expenditure between Rs. 11-Rs. 166) and between Rs. 2351-Rs. 3900 (93.1%) on miscellaneous items (Per capita expenditure between Rs. 534-Rs. 886) per month.
Average of Monthly Per Family and Per Capita Expenditure on Different Food and Non Food Items (Family Income Between Rs. 34001-43000 Per Month)
Among the families belonging to the income group between Rs. 34001 – Rs. 43000, three-fourth (75.0%) of the families used to spend between Rs. 5101-Rs. 7000 on food per month (Per capita expenditure between Rs. 879- Rs. 1206) (Table 4). Majority of the families (87.5%) used to spend between Rs. 1501-Rs.2200 per month on clothing (Per capita expenditure between Rs. 272-Rs.400), 62.5 per cent of families used to spend between Rs. 100-Rs.1600 on shelter per month with per capita monthly expenditure between Rs. 20-Rs.326 and the same number of families (62.5 %) used to spend between Rs. 501-Rs.1000 on medicine per month (Per capita expenditure between Rs. 82-Rs.163).
Monthly expenditure on fuel shows that three- fourth (75.0%) of the families used to spend between Rs. 1801- Rs.2500 per month on fuel (Per capita expenditure between Rs. 310-Rs.431), 62.5 per cent of families used to spend between Rs. 500-Rs.2350 on education (Per capita expenditure between Rs. 87-Rs.412) and 68.7 per cent of families used to spend between Rs. 50-Rs.700 on recreation per month (Per capita expenditure between Rs. 9-Rs.127). Equal number of families (50.0% each) used to spend between Rs. 2351-Rs.3900 and Rs. 3901-Rs.5500 on miscellaneous items per month and their per capita monthly expenditure was between Rs. 470-Rs.780 and Rs. 684-Rs.964.
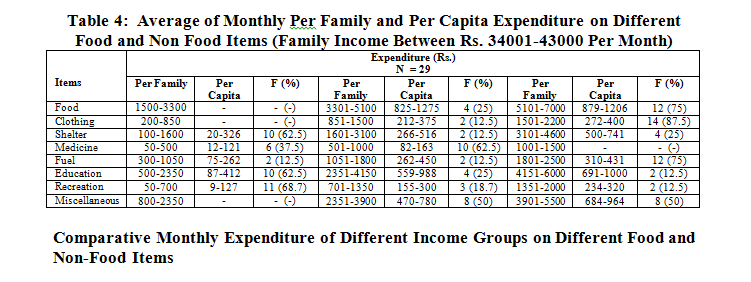
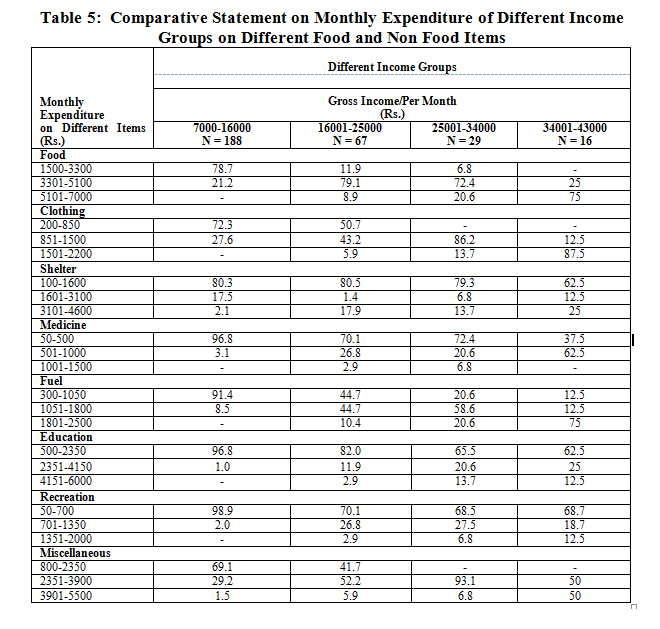
Table 5 shows the comparative monthly expenditure of different income groups on different food and non-food items. It can be concluded that irrespective of the family income, the families spent maximum on food, followed by miscellaneous items. While minimum expenditure in low income families was on medicine and in case of high income families, it was on recreation. It may be concluded from the findings that as the income increased, the percentage spent on food decreased although the actual amount spent on food
increased which proves Engel’s first law of consumption. The present study is also supported by the findings of Sehgal et al (1988) according to whom Engel’s first law of consumption is also proved true in a study conducted in Haryana. Findings of Rodge and Murli (1991) are also in accordance with these findings.
Total Per Family and Per Capita Expenditure (Monthly and Annual)
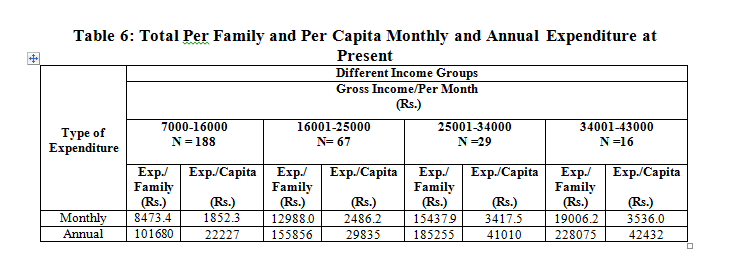
Table 6 reveals that the total monthly and annual expenditure of the families belonging to the income group between Rs. 7000-Rs.16000 (188 families) was Rs. 8473.4 and Rs.101680 and their per capita monthly and annual expenditure was found to be Rs. 1852.3 and Rs. 22227. Among the families belonging to the income group between Rs. 16001-Rs.25000 (67 families), the total monthly and annual expenditure was found to be between Rs. 12988.0 and Rs. 155856, respectively (Per capita monthly and annual expenditure was Rs. 2486.2 and Rs. 29835 respectively). The families which were in the income group between Rs. 25001-Rs.34000 (29 families) used to spend between Rs. 15437.9 and Rs.185255 monthly and annually, respectively (Per capita monthly and annual expenditure was between Rs. 3417.5 and Rs. 41010, respectively). Among the highest income group i.e. 34001-Rs.43000 (16 families), the per capita monthly and annual expenditure was between Rs. 3536.0 and Rs. 42432, respectively, whereas these families used to spend between Rs.19006.2 and Rs. 228075 respectively.
This analysis shows that as the income increases, the per capita and per family expenditure also increases.
Conclusions
Irrespective of the family income, the families spent maximum on food, followed by miscellaneous items. While minimum expenditure in low income families was on medicine and in case of high income families, it was on recreation.
It may be concluded from the findings that as the income increased, the percentage spent on food decreased although the actual amount spent on food increased
References
Burger A (2002) Consumption of Fruits and Vegetables. ISHA Acta Horticulturae 77: V Symposium on Horticulture Economics, Available at www.research gate.net.
Debroy B (2001) Take-Hme Package. The Week. December: 43.
Dubey OP (2001) Potential of the Insurance Business in India, Available at www.research gate.net.
Oladeji SI and Ogunrinola IO (2001) Determinants of Informal Savings in South- Western Nigeria. Saving and Development 25(2): 225-251.