Alleviation: An International Journal of Nutrition, Gender & Social Development, ISSN 2348-9340
Volume 4, Number 4 (2017), 17-23
© Arya PG College, Panipat & Business Press India Publication, Delhi
www.aryapgcollege.com
Impact of Nutrition Education on the Health of Working Women
Abha Khetarpal
Head, Department of Home Science
DAV College for Girls, Yamunanagar , Haryana, India
Email: abhakhetarpal@rediffmail.com
Introduction
Working women today constitute 22.7 percent of total population in India as against 51.5 per cent of the male workers. Globally women areprojected to account 47 per cent of the labour force by the year 2005 (Harshala and Premakumar 2000). Women’s health is of the utmost importance as it reflects the health of family. Diet forms an important component of health and nutritional status of an individual /family/community. The food and nutrient intake affects the work capacity and output. An individual occupation hasbeen shown tohave a significant effect on the type offoods and nutrients consumed and hence their nutritional status (King et al 1997).
Anthropometric measurements of human body reflect changes in the morphological variation due to inappropriate food intake. Women with no regular physical activity tend to have increased body mass which often promotes obesity. When energy intake is greater than expenditure, a positive energy balance occurs, which causes an increase in energy store percentage and body weight.
Dual stress of work (in and outside the home) has adverse effect on nutritional status of women (Jain and Singh 2003). Hence, the need for detailed depiction of efficacy of nutrition counseling on food intake and anthropometric profile of working women is imperative. Keeping this point in view, the present studywasundertaken.
Materials and Methods
A sample of seventy working women (35-45 years) belonging to middle income group was selected randomly from four schools of District Yamunanagar and equally divided into two groups viz., Experimental (E) and Control (C).
A complete record of the food intake of each subject was kept by 24 hour recall method for three consecutive days using standardized containers at T1 and T2 and was compared with ICMR Recommendations (1999). Height, Weight, Mid Upper Arm Circumference (MUAC), Triceps Skin Fold Thickness (TSFT) were recorded and Body Mass Index (BMI) and Waist Hip Ratio (WHR) were calculated at T1 and T2 in both the groups using standardized techniques as per Jelliffe (1996).
A module (printed booklet) was developed in English and distributed to the subjects of group E after pre-testing (T1). It contained information about balanced diet, functions of different nutrients and their requirements, nutritional disorders and their control and prevention, cooking practices, use of sprouted and fermented foods etc. Nutritional Counseling was also imparted by participatory demonstrations, audiovisual aids etc by nine individual and three group contacts. The results were statistically analyzed by using student’s t-test and correlation co-efficient (r) was also computed.
Results and Discussion
The demographic information of the subjects revealed that the average per capita income was Rs. 2517±121.5 and Rs. 2243±109.2 in Group E and C respectively. The per capita income of the subjects was higher as per figures of India and Punjab as Rs. 1498.17 and Rs. 2137.67 respectively at current prices (Anonymous 2002),which indicated that the subjects of the present study had higher income. Regarding the dietary habits, it was observed that 77 per cent and 71 per cent and 23 per cent and 29 per cent of subjects were vegetarian and non-vegetarian in Group E and C respectively. It was surprising to note that 54 per cent and 60 per cent of the subjects in Group E and C were in habit of skipping one meal a day i.e. either breakfast or lunch. It was observed that those subjects, who had skipped their one meal, took the next meal much heavier. Majority of the subjects (74% and 86% in E and C group) admitted that they were fond of eating out/buying readymade foods such as samosa , bread pakora, patties, pizza , noodles , and burger etc.
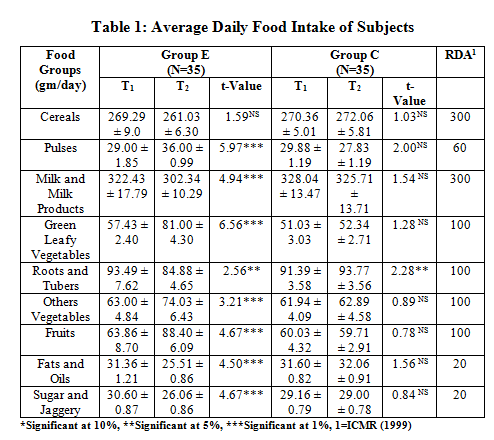
Food Intake by the Subjects
The data in Table 1 indicated that the mean daily intake of cereals by Group E and C was 269.29± 9.0 and 261.03±6.3 gm and 270.3 ±5.01 gm and 272.06±5.81 gm at T1and T2 respectively and the difference between the groups was non-significant. The intake of cereals was marginally less than the suggested intake of 300 gm (ICMR 1999) in both the groups. The daily intake of pulses was 29±1.85 gm and 36±0.99 gmand 29.88±1.19 gmand 27.83 ±1.19 gm in Group E and C at T1 and T2 respectively, which was inadequate when compared to suggested intake of 60 gm (ICMR 1999). The intake of milk and milk products was higher in both the groups, but a significant decrease (p<0.01) was observed at T2 in Group E due to decreased consumption of tea and other milk products. Similar findings were also reported by Nagi and Mann (1991) and Varmeet (1993). Further, lower intake of GLVs, roots and tubers, other vegetables and fruits were observed at T1 in both the groups. But at T2, their intake had improved in Group E as the subjects were convinced to increase their consumption. The foods of great concern in the present study were fats and oils and sugar and jaggery. The mean daily intake of fats and oils was 31.36±1.21 gm and 25.5±0.86 gm in Group E and C at T 1 and T2 respectively, which was inadequate when compared to suggested intake of 60 gm (ICMR 1999) in both the groups. The decrease in the intake of fats and oils was observed in Group E, which might be due to decreased consumption of fried foods , fast foods and whole milk in their daily dietaries. The higher intake of sugar and jaggery was due to higher consumption of tea, gajerela, pinnis, panjeeri, peanuts, seasame chikki, and sweet dishes etc. The survey was conducted in winter season. But during nutrition counseling, the subjects of Group E were taught to reduce the intake of such high energy foods as it resulted in overweight and further to obesity, diabetes, hypertension, and coronary heart disease.
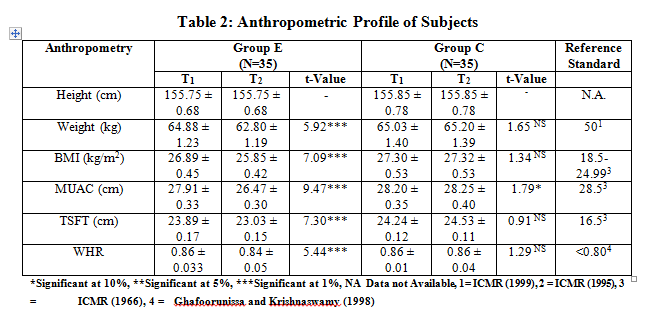
Anthropometric Profile of the Subjects
The results of various anthropometric measurements of the subjects are summarized in Table 2. The average height of the subjects was 155.7± 0.68 cm and 155.85± 0.78 cm. The height of the subjects recorded in the present study was less as compared to standards (164 cm) given by ICMR (1990). The average weight of the subjects was 64.8±1.23 kg and 65.03±1.40 kg in Group E and C respectively at T1.The corresponding valuesat T2 were 62.8±1.19 kg and 65.2 ±1.39 kg. The decrease in weight was 2 kg in Group E which could be due to increase in physical activity, increased involvement in household activities and reduction in total energy intake especially from fats and sugars. On the other hand, there was no reduction of weight in Group C at T2.
The mean BMI values (Table 2) in Group E was 26.8± 0.45 kg/m2 and 25.8±0.42 kg/m2, while in case of Group C, the corresponding figures were 27.30±0.53 and 27.32 ±0.53kg/m2 at T1 and T2 respectively.
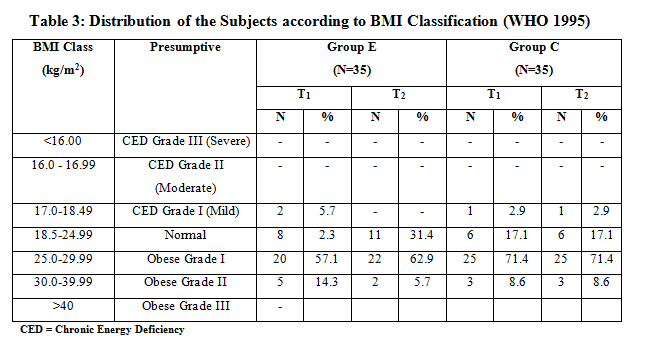
According to BMI classification (WHO 1995), it was observed that majority of the subjects i.e. 57.1 per cent and 71.4 per cent were in the category of 25.0- 29.9 kg/m2, 14.3 per cent and 8.6 per cent were in category of 30.0-39.99 kg/m2 in Group E and C respectively at T1 (Table 3). After nutrition counseling, the corresponding figures were 62.9 per cent, 5.7 per cent, 31.4 per cent in Group E while no change was observed in the BMI. The subjects were taught to control their increasing body weight which could be responsible for obesity and further led to many health problems.
The average MUAC of the subjects was less as compared to standards 28.5cm (Jelliffe 1966) at T1 and T2 of both the groups. The average TSFT values were 23.89±0.17 mm and 23.03±0.15 mm of Group E and 24.24±0.12 mm and 24.53±0.11 mm of Group C at T1 and T2 respectively. It was seen that TSFT values were higher in both the groups than suggested value of 16.5 mm as reported by Jelliffe (1996). A decrease in TSFT at T2 was significant in Group C. Similarly Sharma (1998) reported a significant (p<0.01) decrease in TSFT values from 29.09±6.02 to 27.5± 5.41 mm after imparting nutrition counseling. The WHR values in both the groups were on higher side when compared with the recommended value of <0.80 in females (Ghafoorunisa and Krishnaswamy 1998). There was significant (p<0.01) decrease in WHR in Group E at T2 which might be due to reduction in body weight as they were taught to decrease the intake of fats and sugar in their daily diet.
Conclusion
It was seen that inspite of high intake of many food groups and good purchasing power, the diet of the working women was not balanced. Poor nutritional status among working women could be due to poor nutrition, dual stress of household chores and official work. The results of the current investigation suggested need to focus attention on nutrition counseling to facilitate the intake of high fibrous foods like whole cereals, pulses, sprouted pulses, fruits, salads etc., skimmed milk and non inclusion of fried foods and sweet meats in their daily dietaries to improve their nutritional status. It was observed that old myths were engraved in their minds which need minimum six months of interaction with the subjects.
References
Anonymous (2002) Statistical Abstract of Punjab. Chandigarh: Government of Punjab: 68-103.
Anonymous (2004) A Reference Manual. Government of India: Ministry of Information and Broadcasting: 11-12.
Ghaffoorunisa and Krishnaswamy (1998) Diet and Heart Disease. Hyderabad: NIN: 21-62.
Harshala R and Premakumari S (2000) Health and Nutritional Status of Working Women in Coimbatore and their Exposure to Occupational Hazards. Indian J. Nutr. Dietet (37): 381-388.
ICMR (1999) Dietary Guidelines for Indians (1918-1998) - A Manual. Hyderabad: National Institute of Nutrition.
ICMR (1990) Nutrient Requirements and Recommended Dietary Allowances for Indians. Hyderabad: National Institute of Nutrition: 120.
Jain H and Singh N (2003) A Study on the Nutritional Status of Women in the Age Group of 25-50 Years Working in Sedentary Job in Jaipur City. Indian J. Nutr. Dietet (40):91-98.
James WPT, Mascie T , Norgan NG, Bristrian BR, Shetty P, and Ferro LA (1994) The Value of Arm Circumference Measurements in Assessing Chronic Energy Deficiency in Third World Adults. Eur J ClinNutr 48:883-894.
Jellifee DB (1966) The Assessment of Nutritional Status of Community. Geneva: World Health Organization: 171.
King NA (1997) Effects of Exercise on Appetite Control- Implications’ for Energy Balance. Medicine and Science in Sports and Exercise (29): 1076-1089.
Nagi M and Mann SK (1991) Nutrient Intake by Punjabi Women with Special Reference to Iron Availability. j. Fd. Sci. Tech (28): 230-233.
WHO (1995) Physical Status- The Use and Interpretation or Anthropometry. WHO Technical Report Series 854E. Geneva: WHO.